Clean Data: A Map of Shinpei Takeda’s Artistic Trajectory
Clean data is an imperative when working with mapping visualization technologies. It is through the presence and proper formatting of the data that Carto (the mapping software program I used) represents “reality” – a reality that is only real insofar as it is properly recorded. For my final map, I have juxtaposed two different social geographies. The first one is seen through the purple dots that move across the plane. Each one marks the specific coordinates of important life events and exhibits in the career of visual artist Shinpei Takeda.
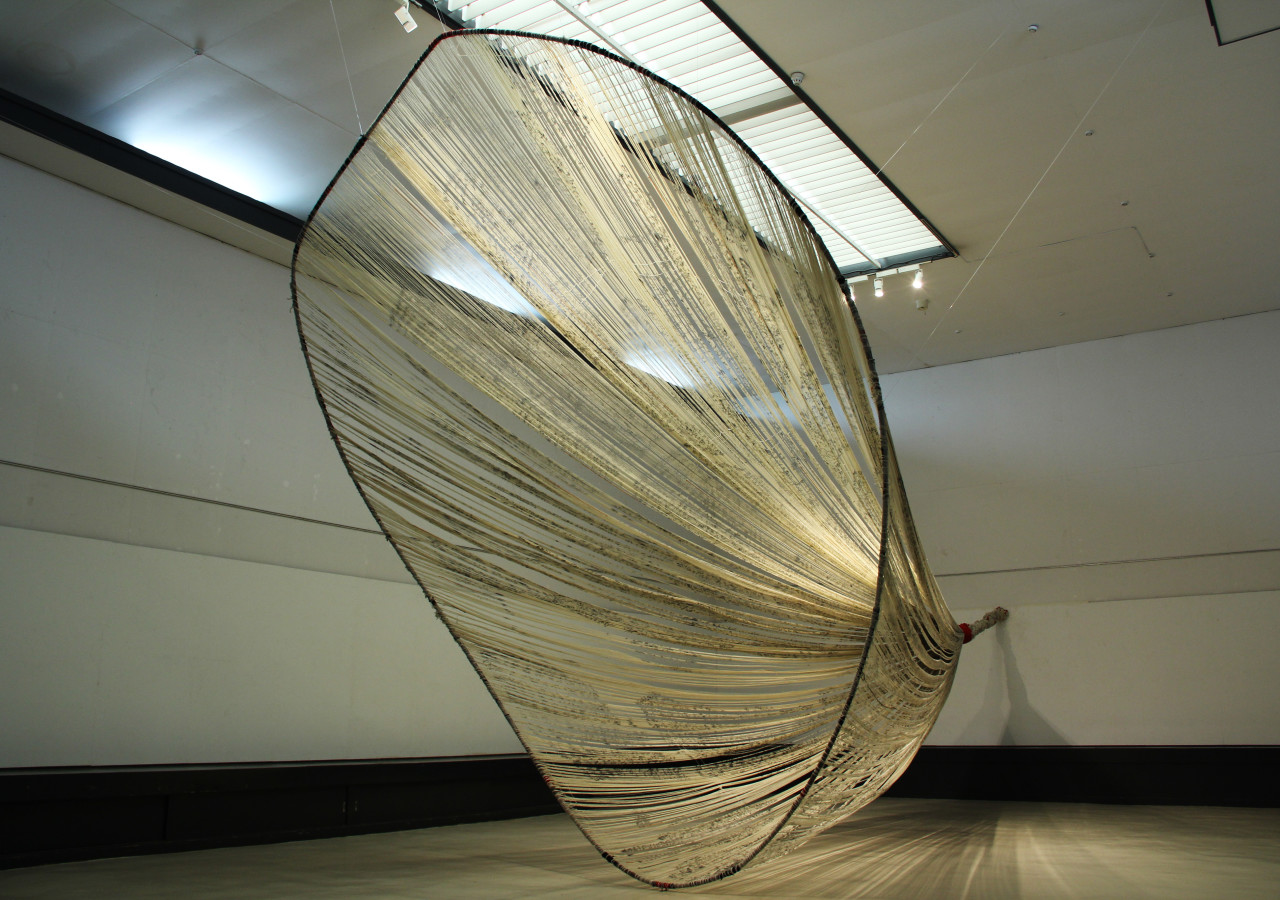
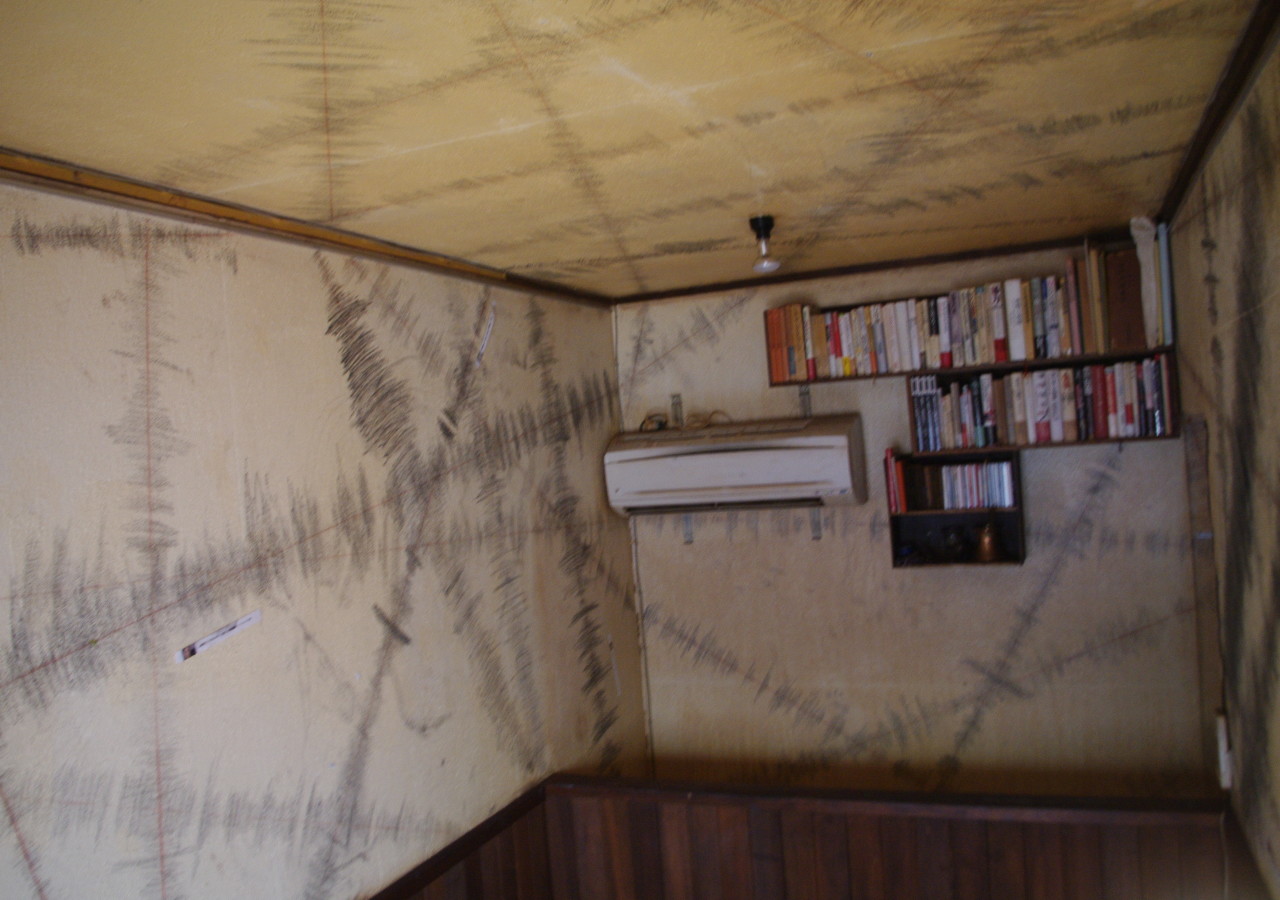
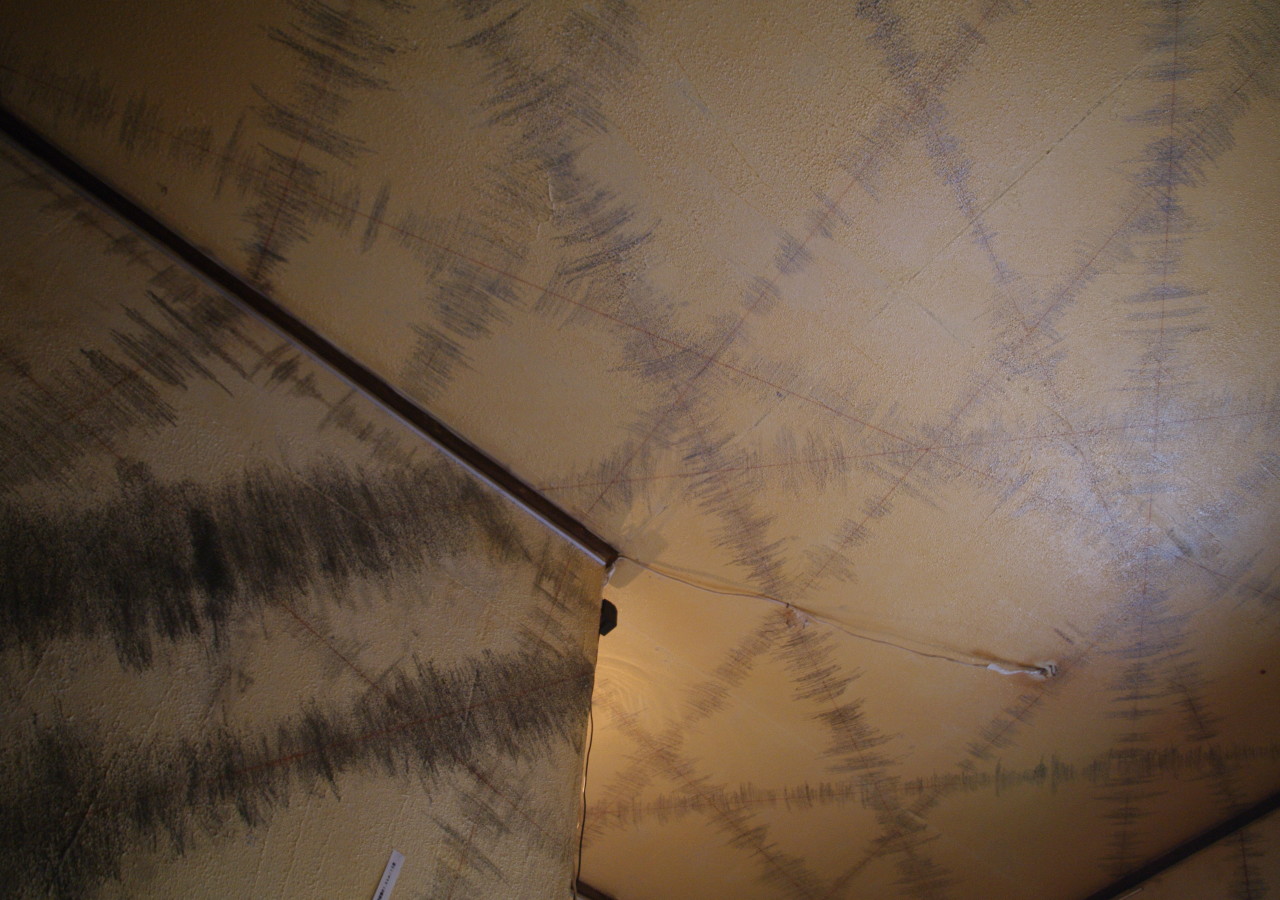
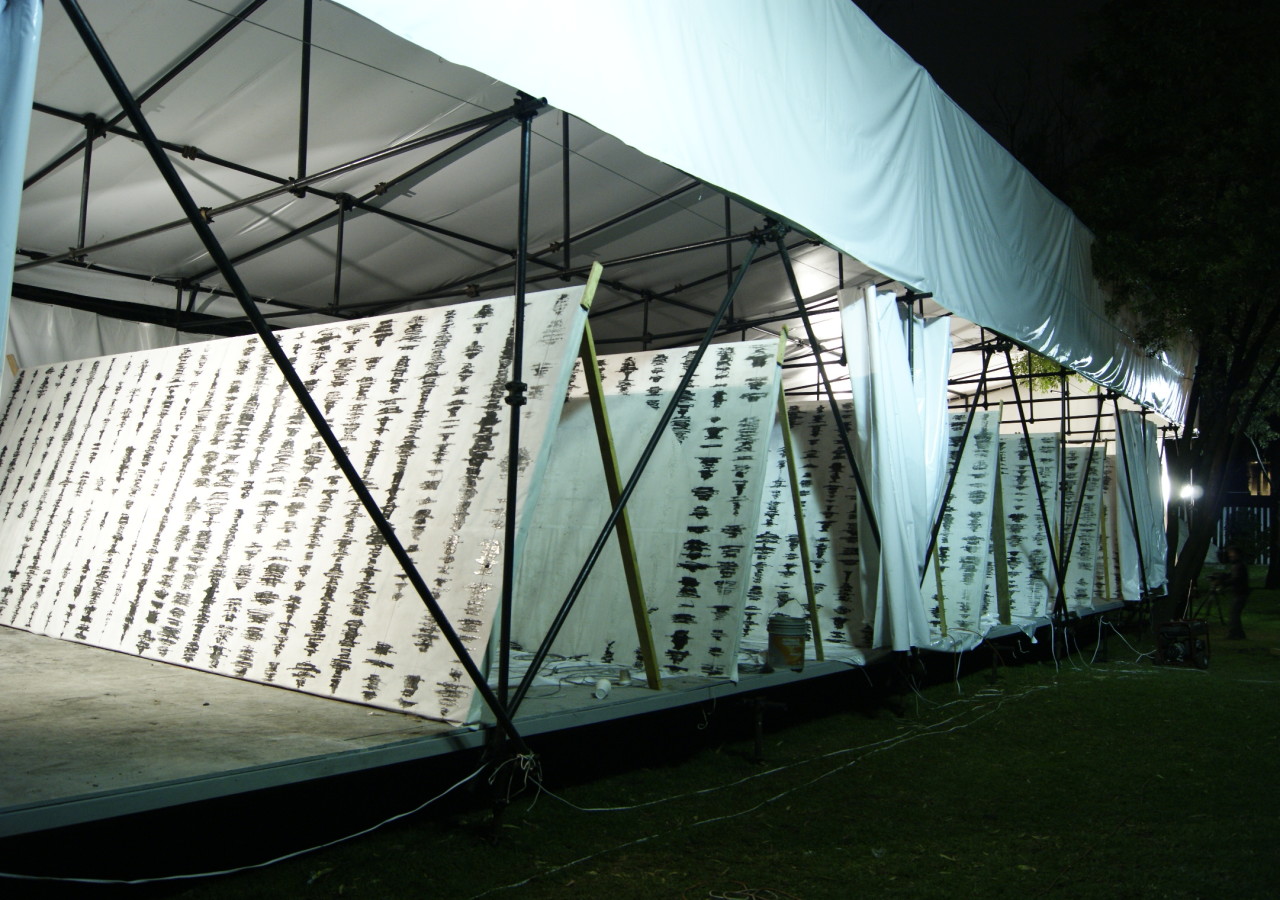
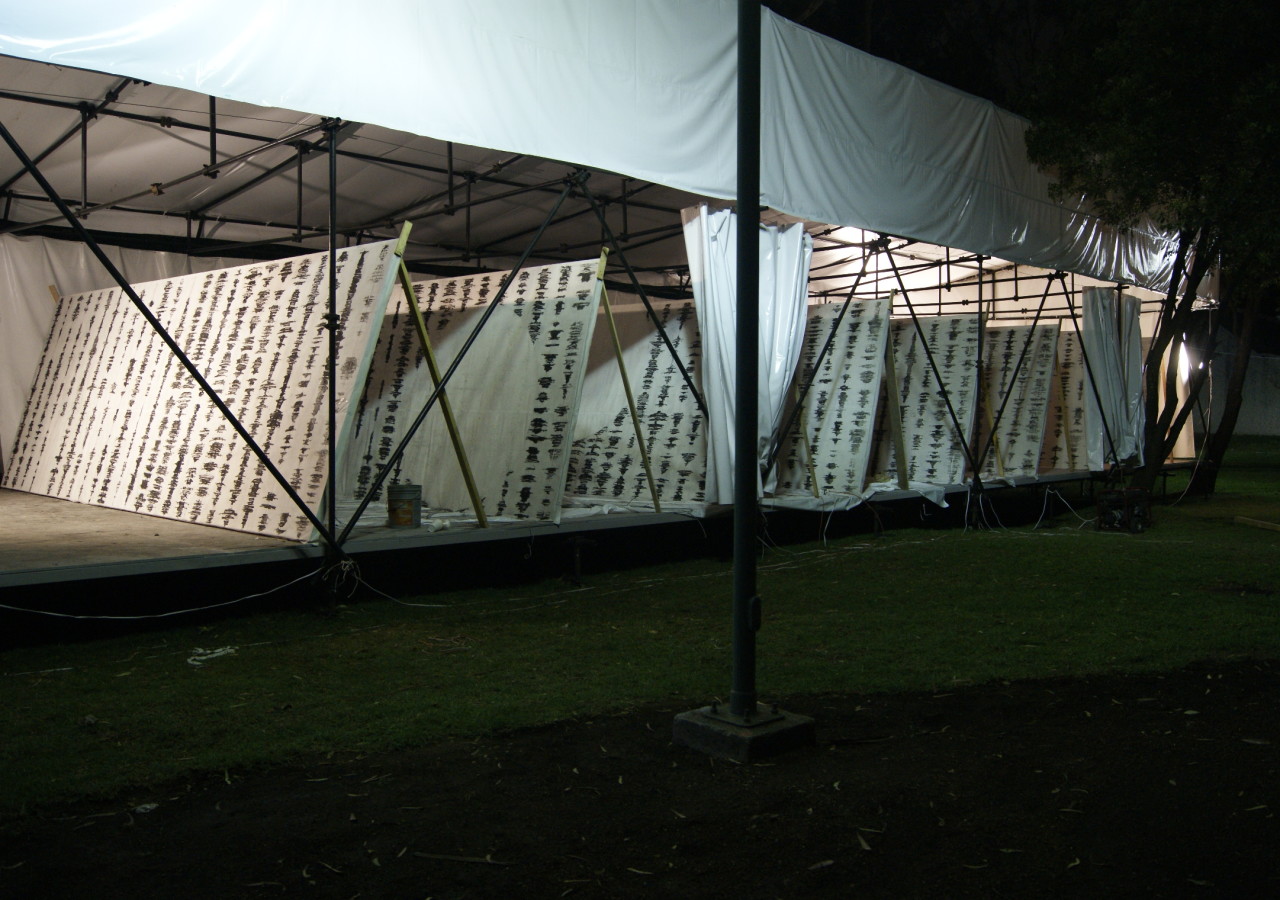
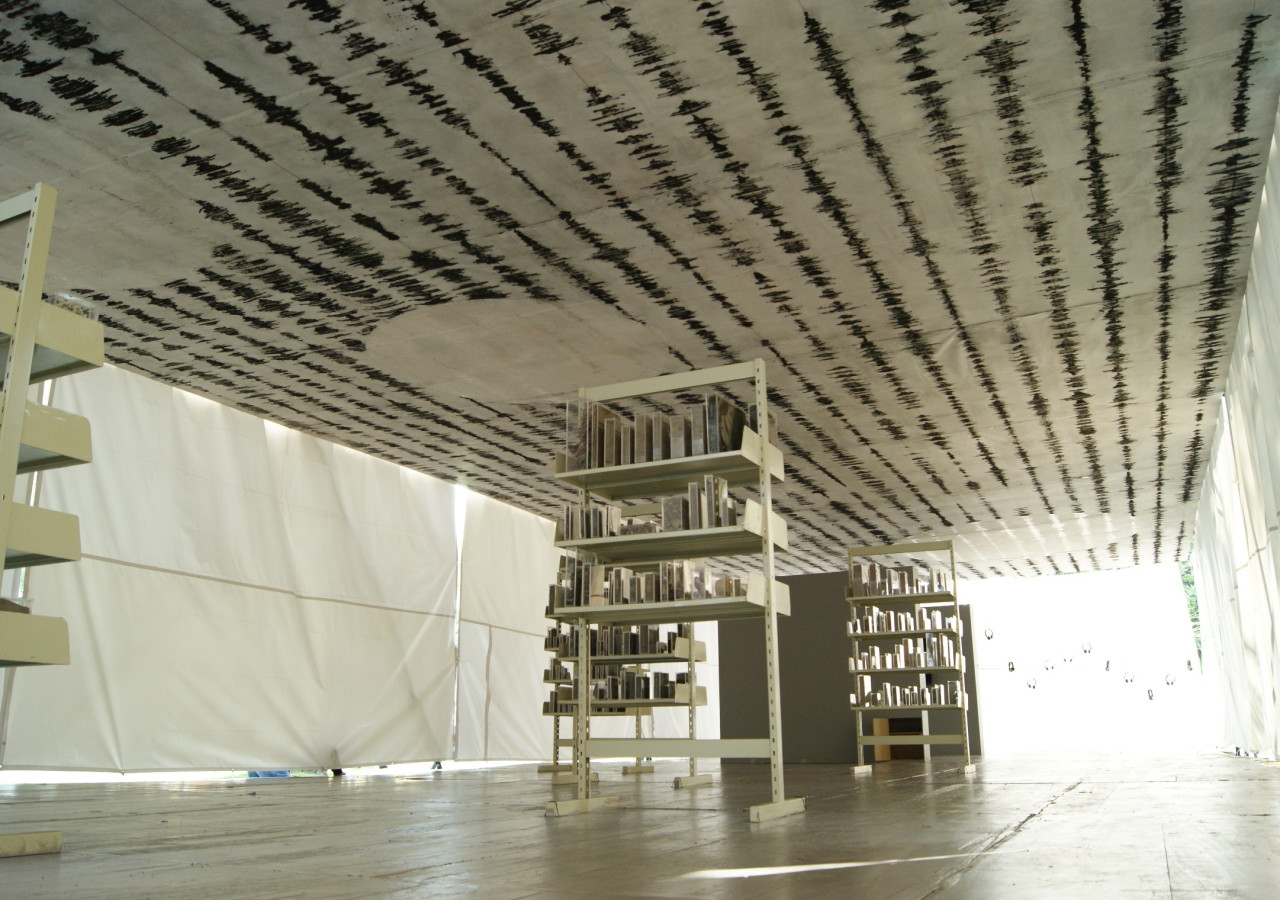
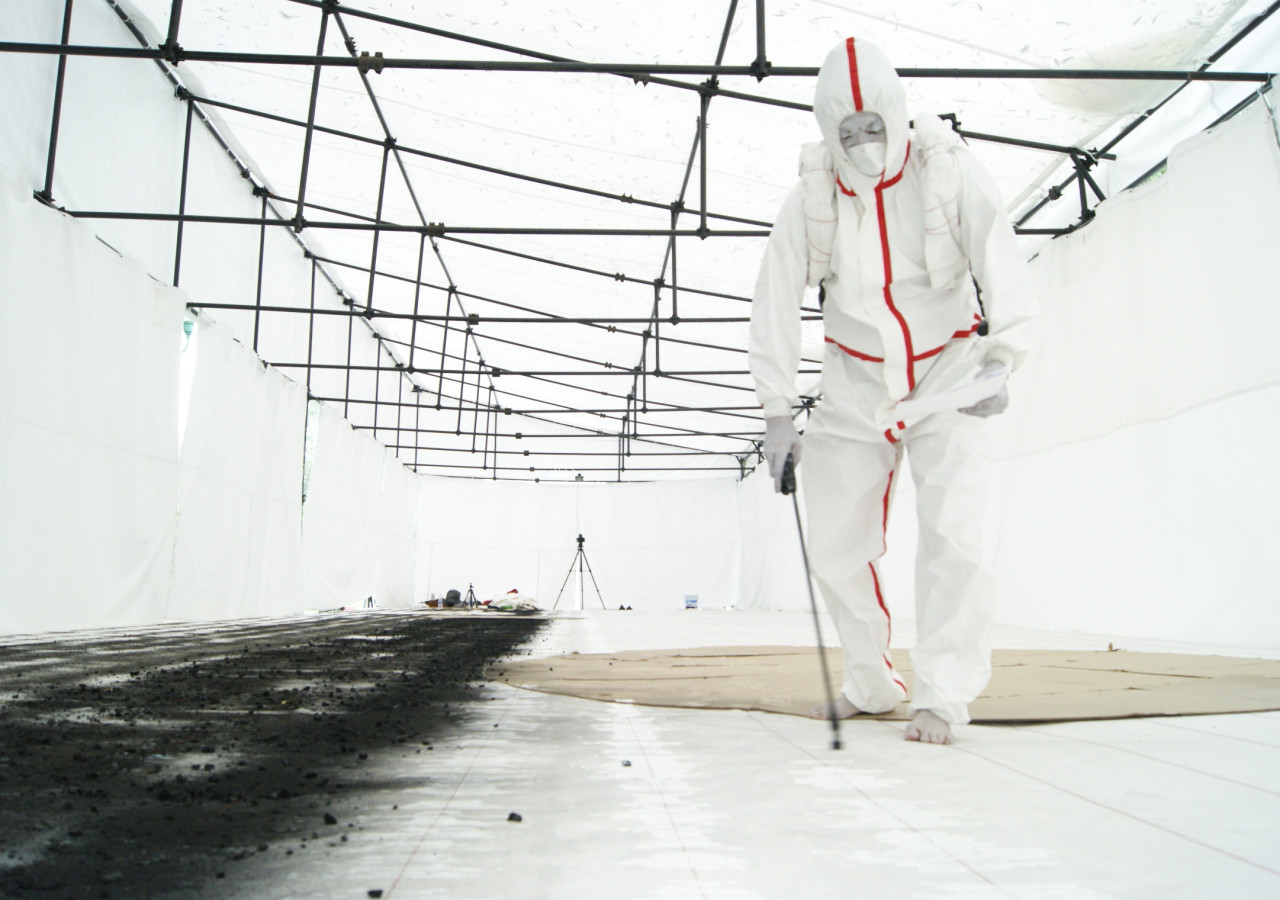
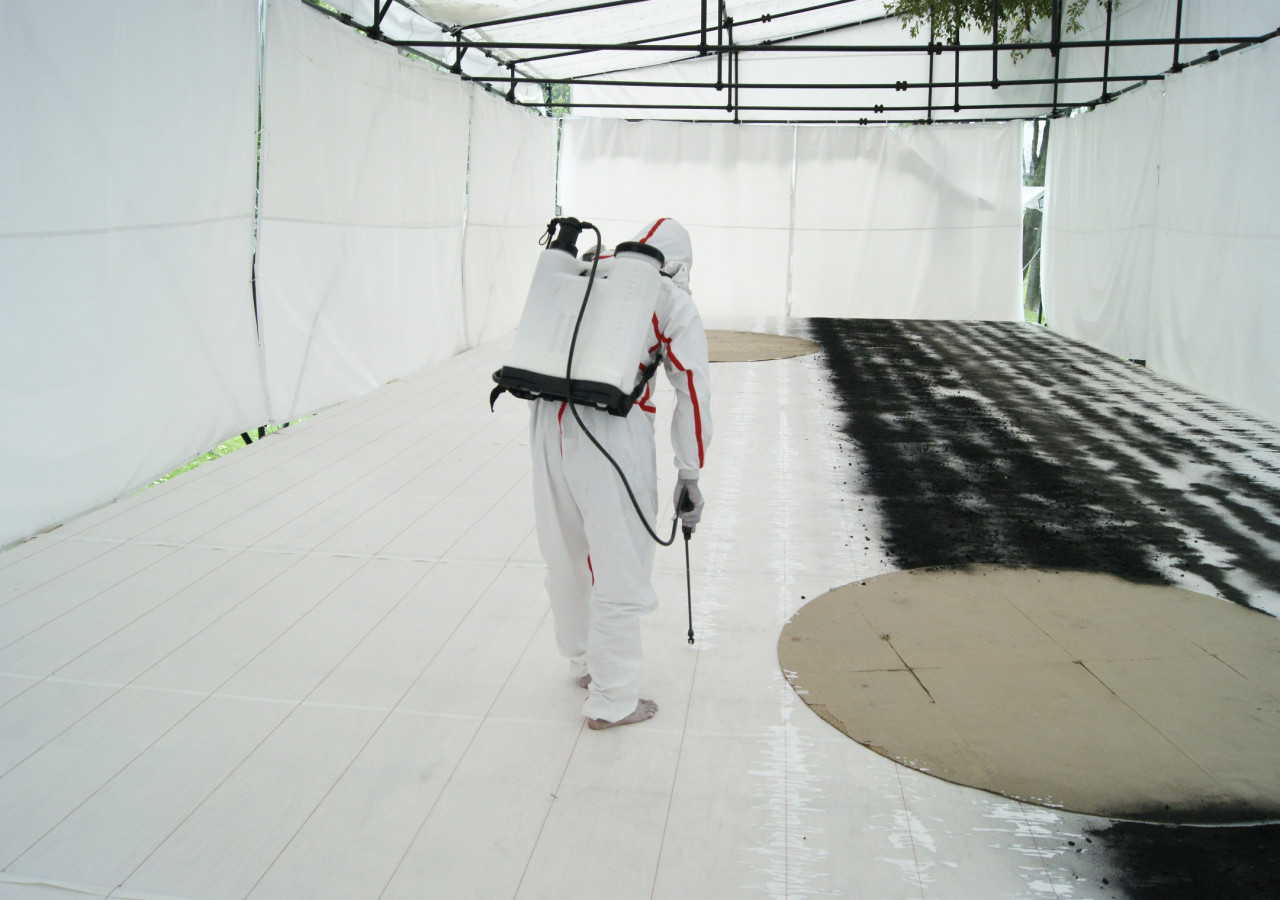
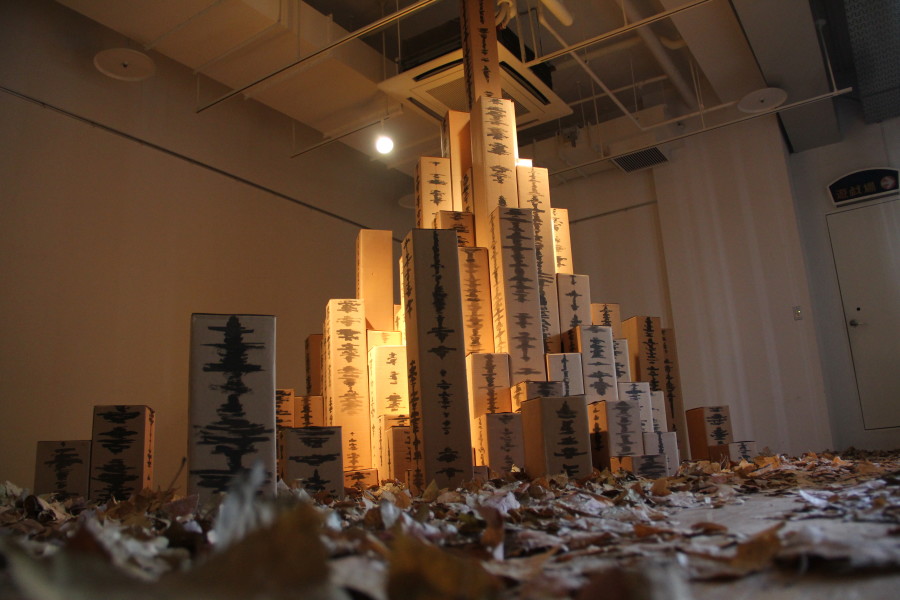
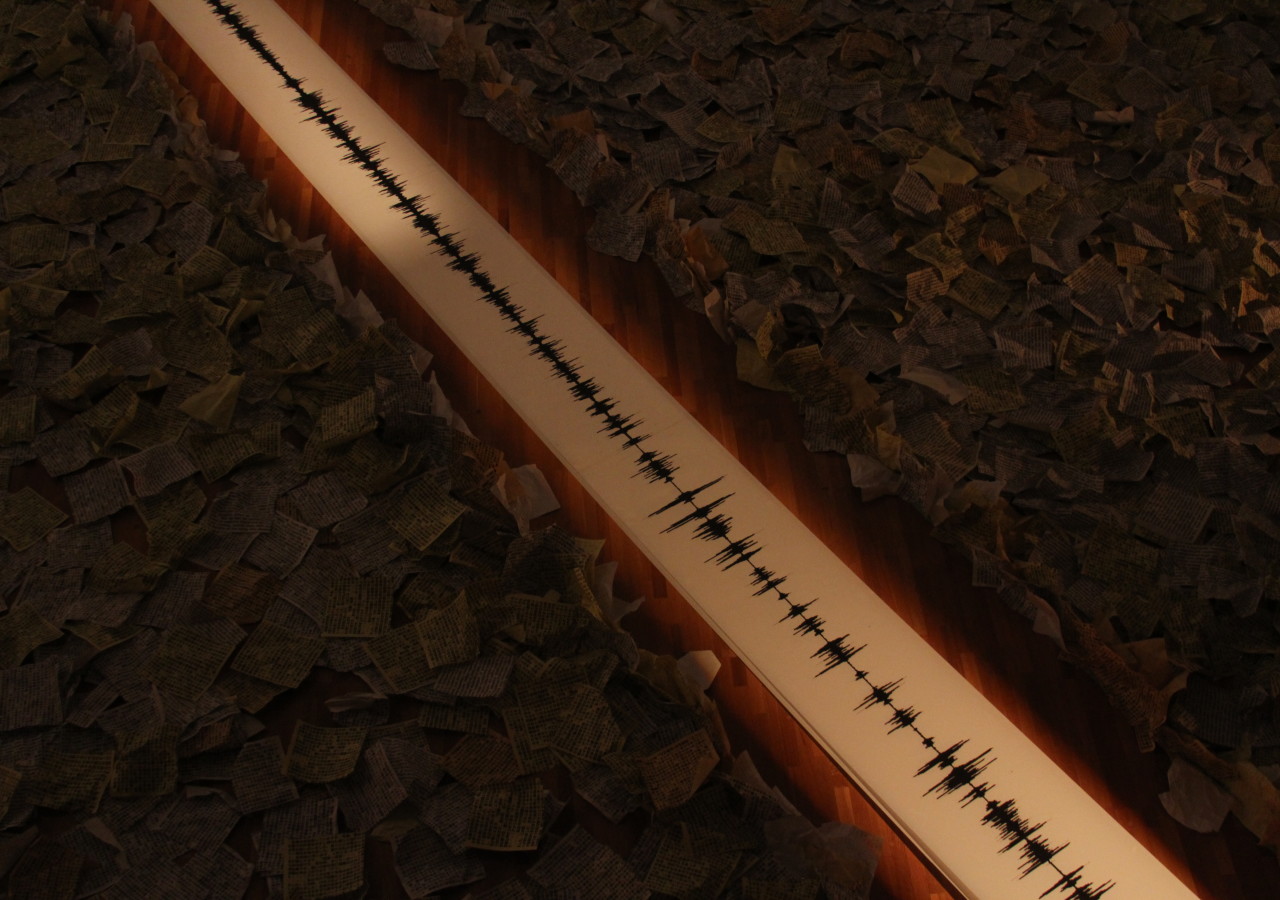
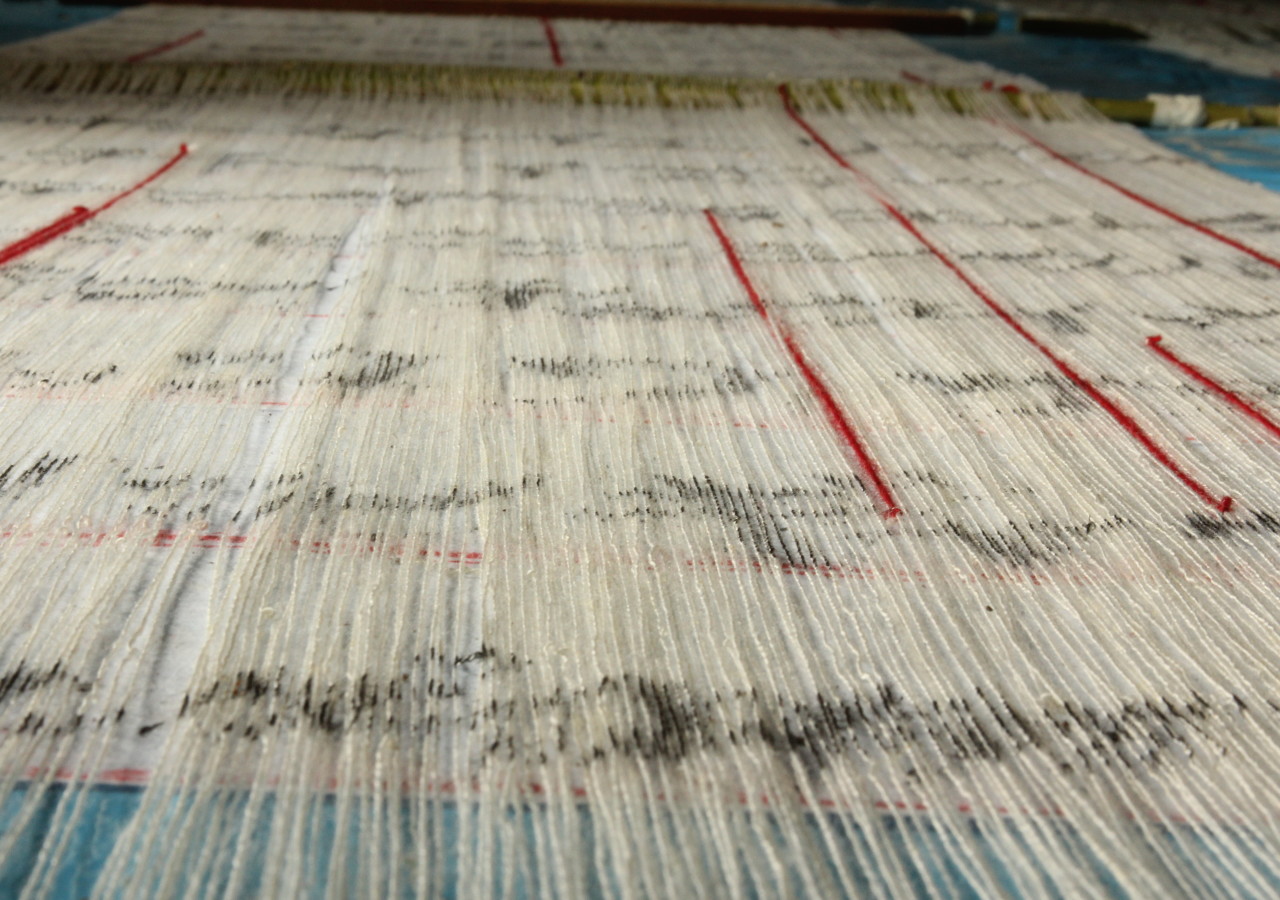
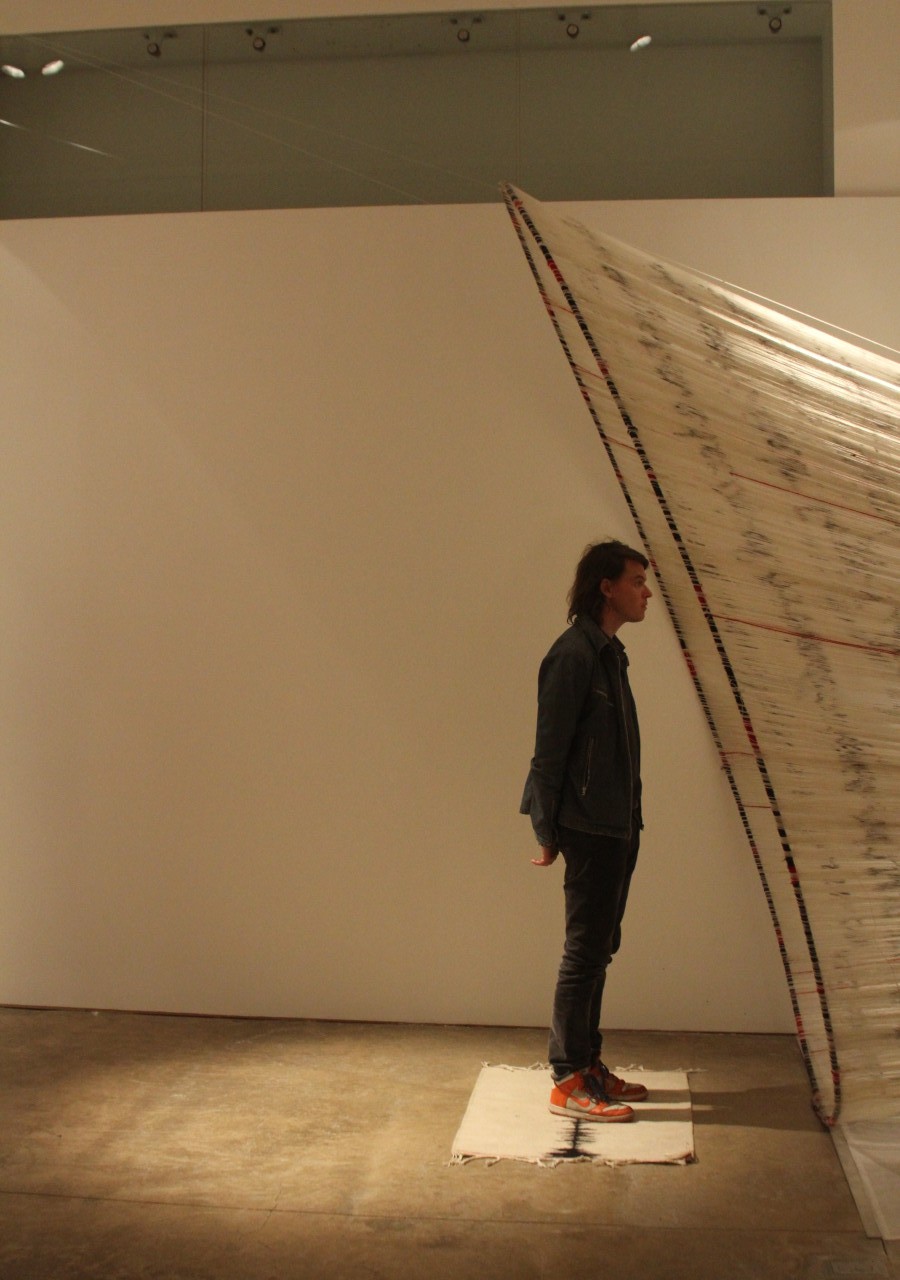
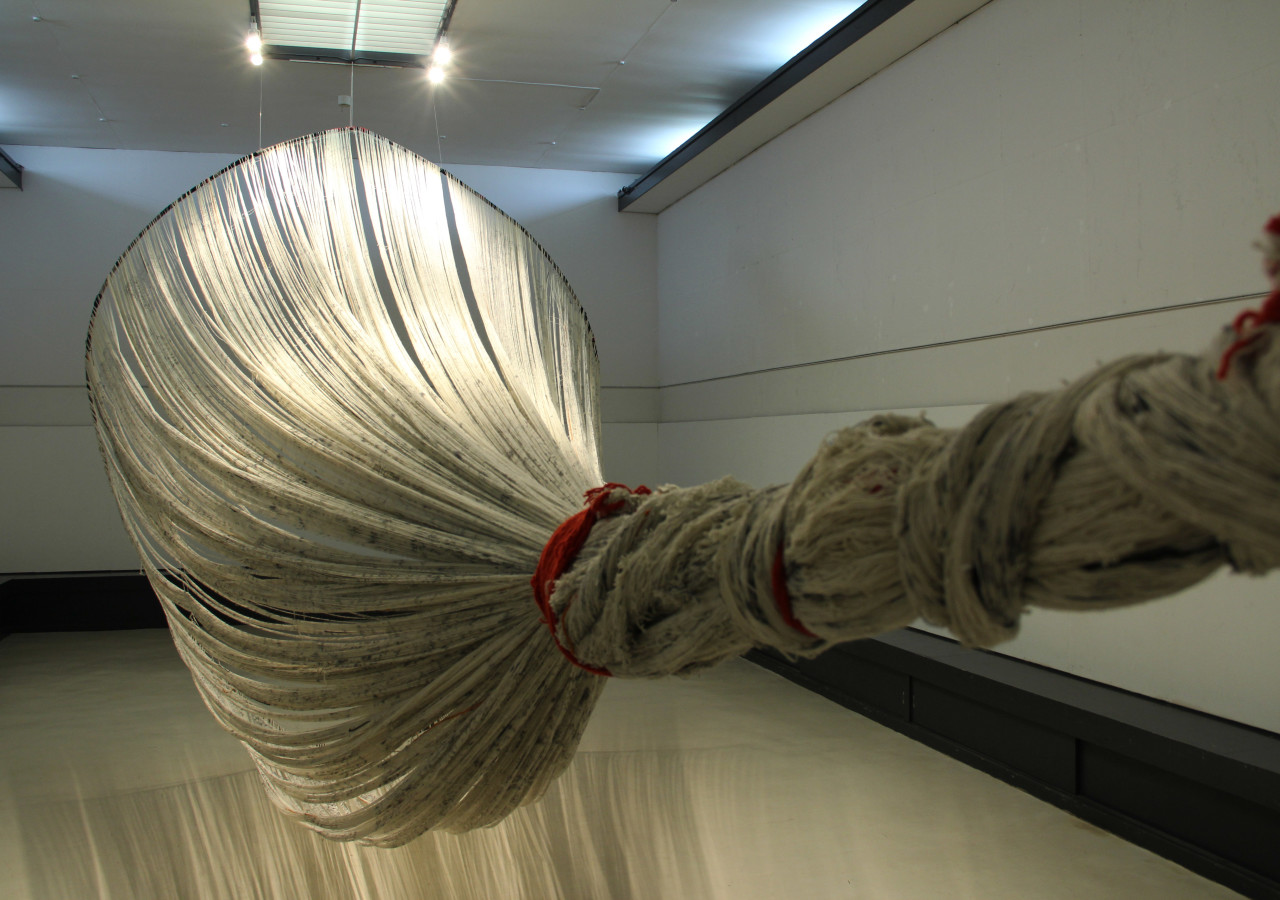
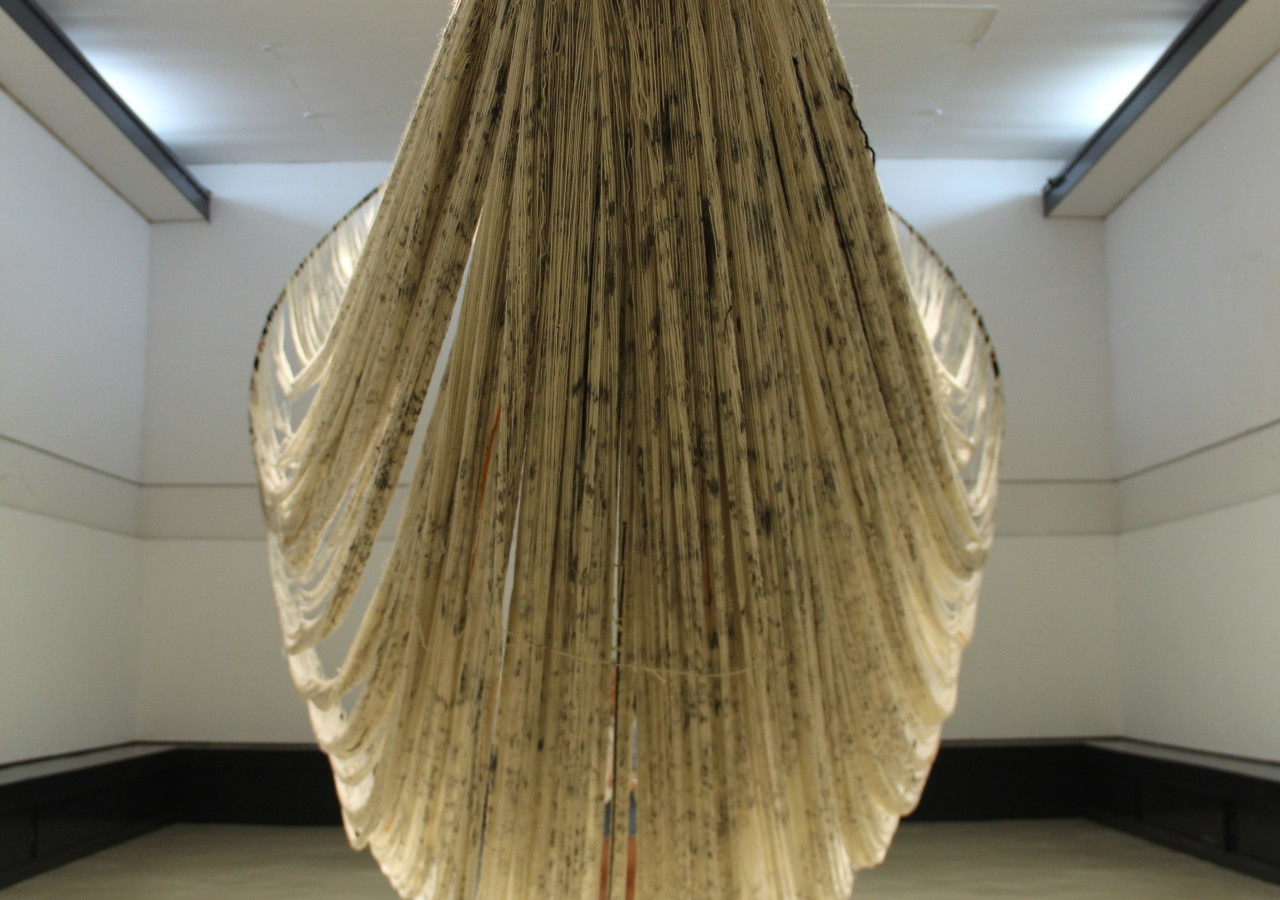
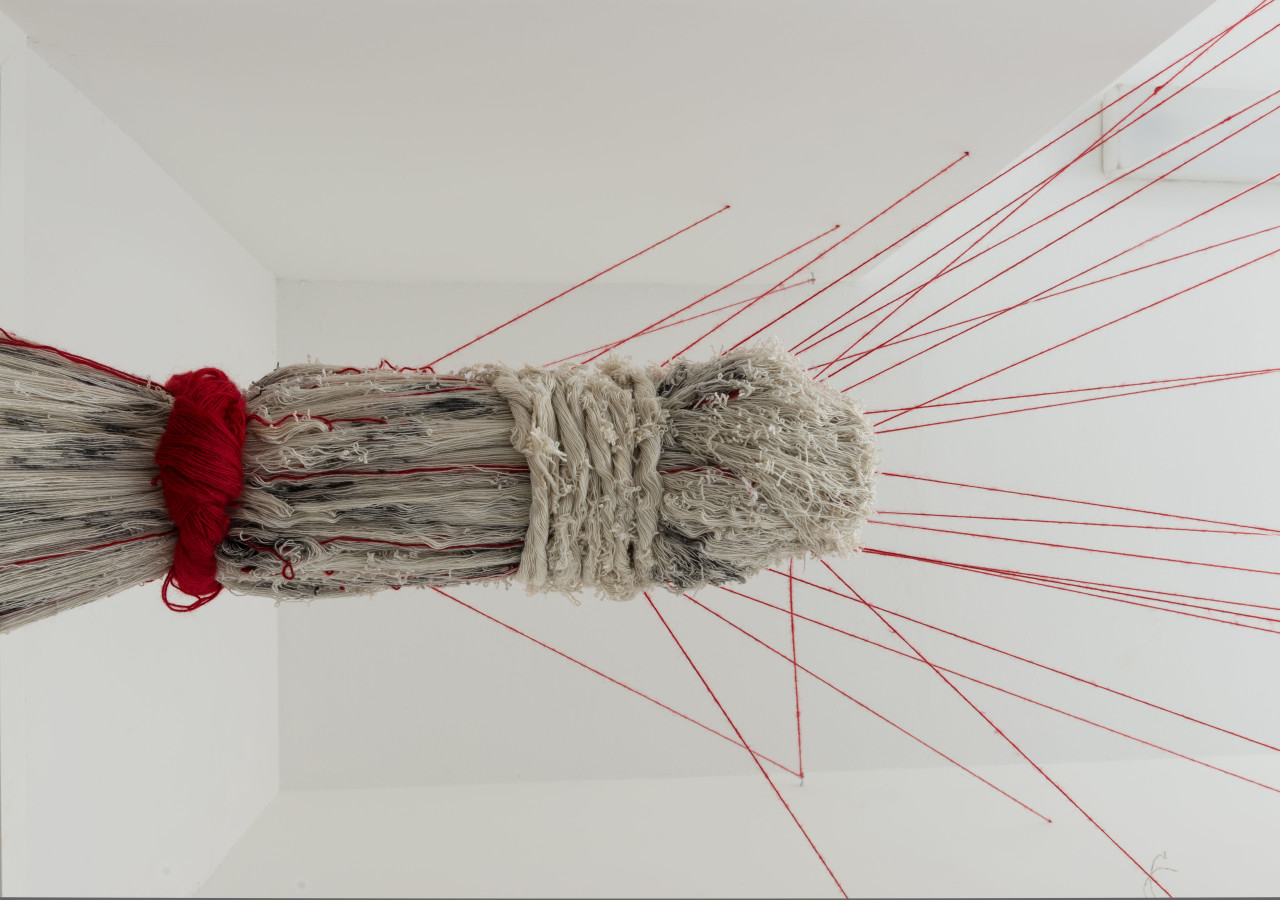
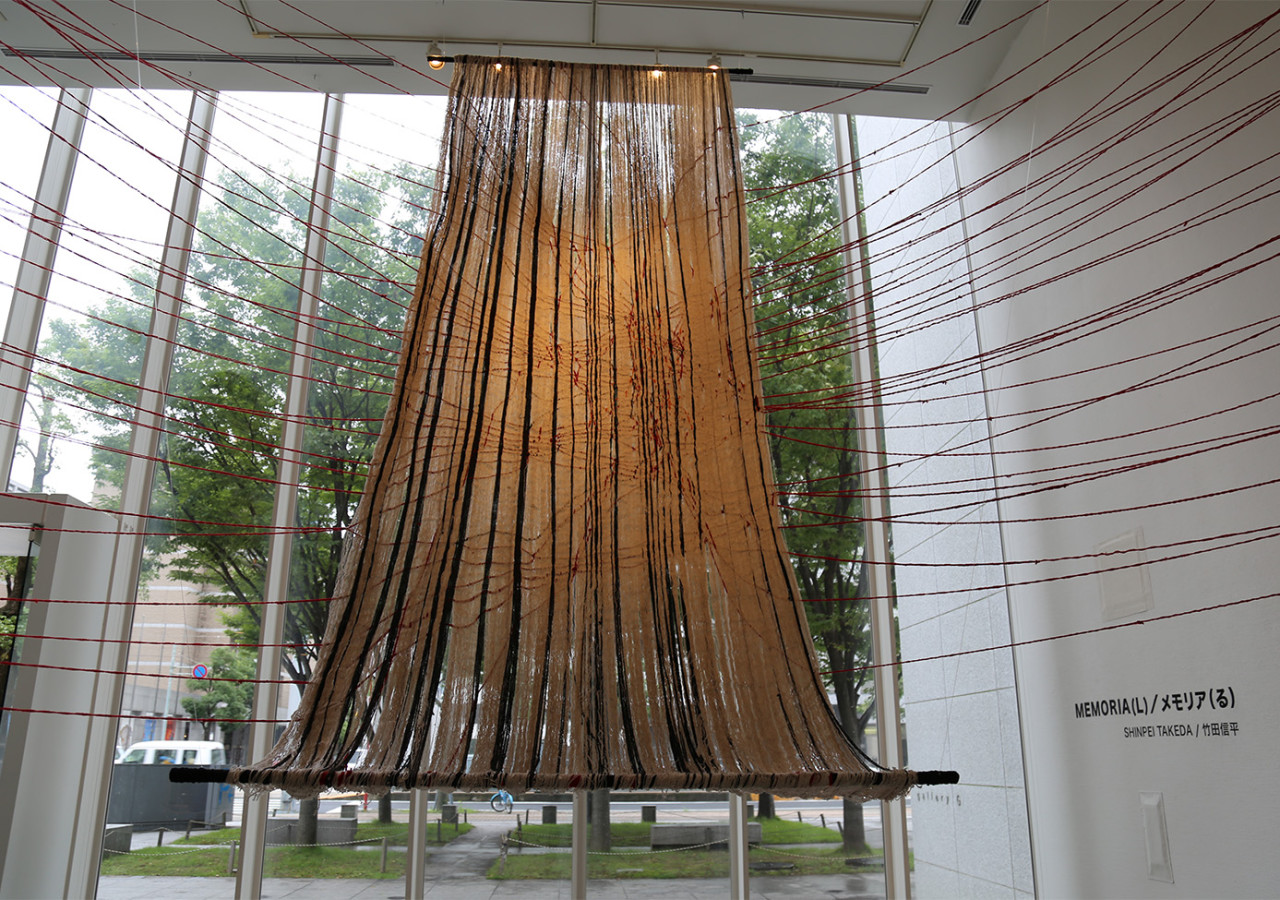
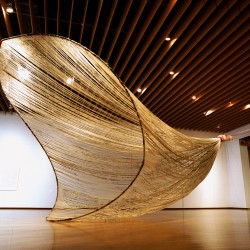
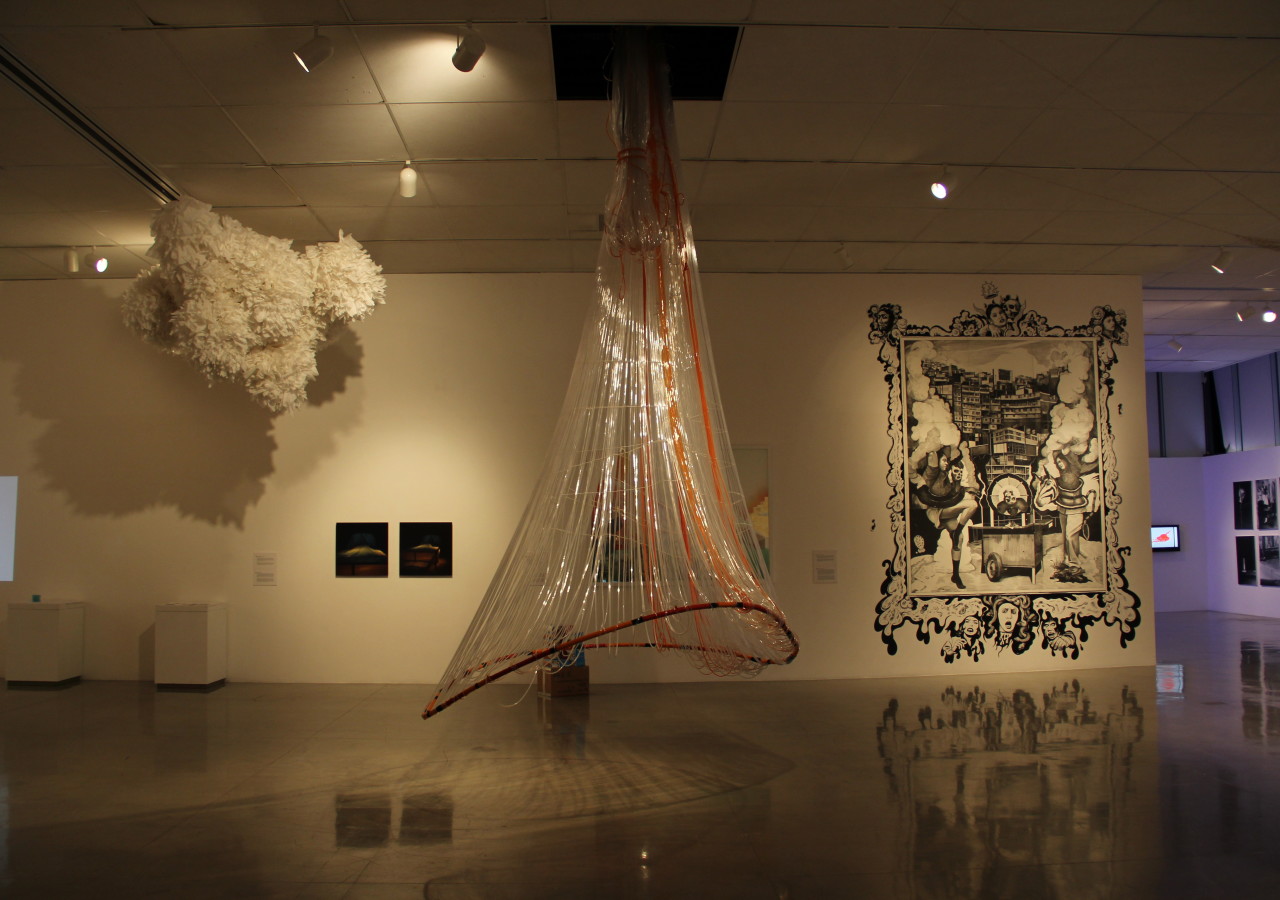
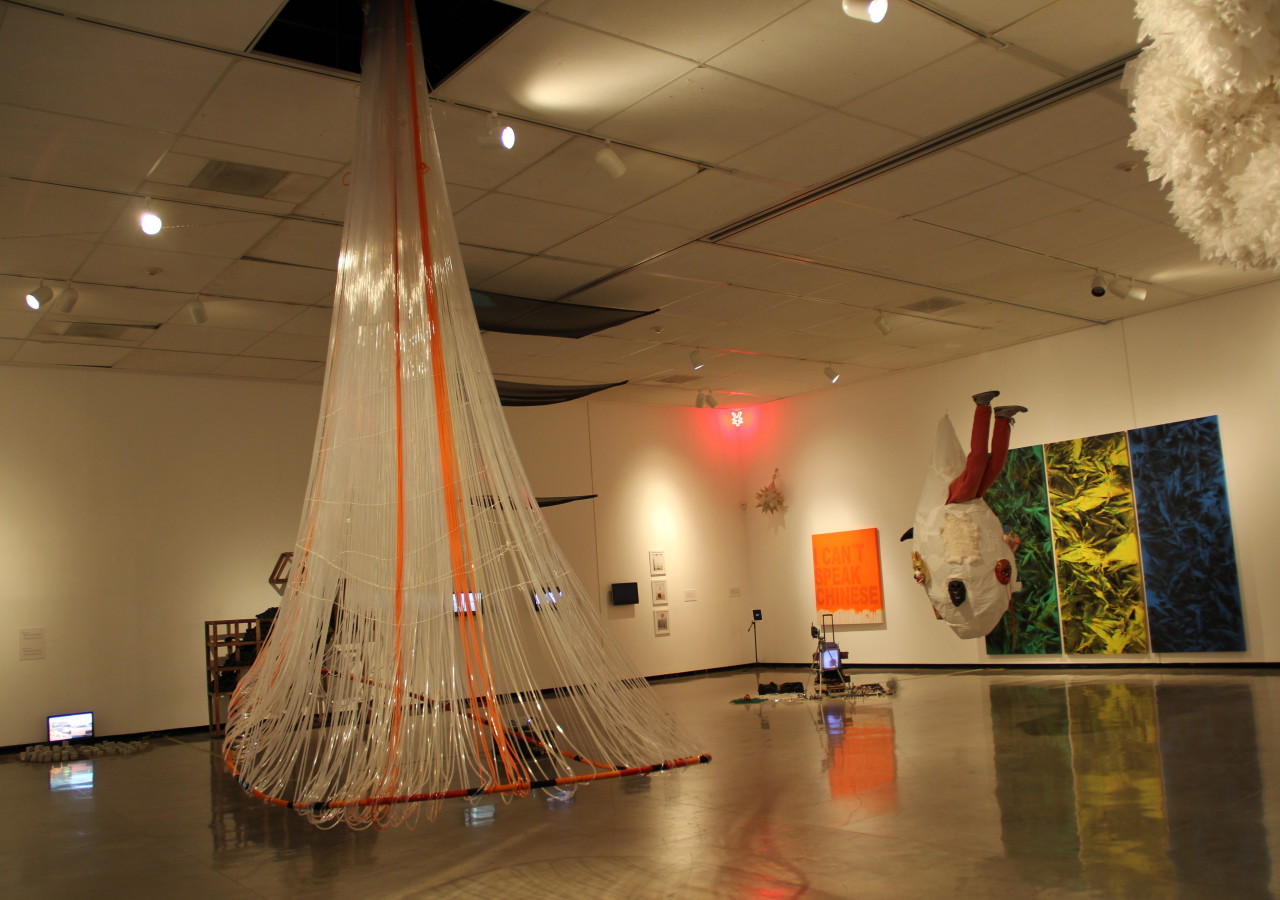
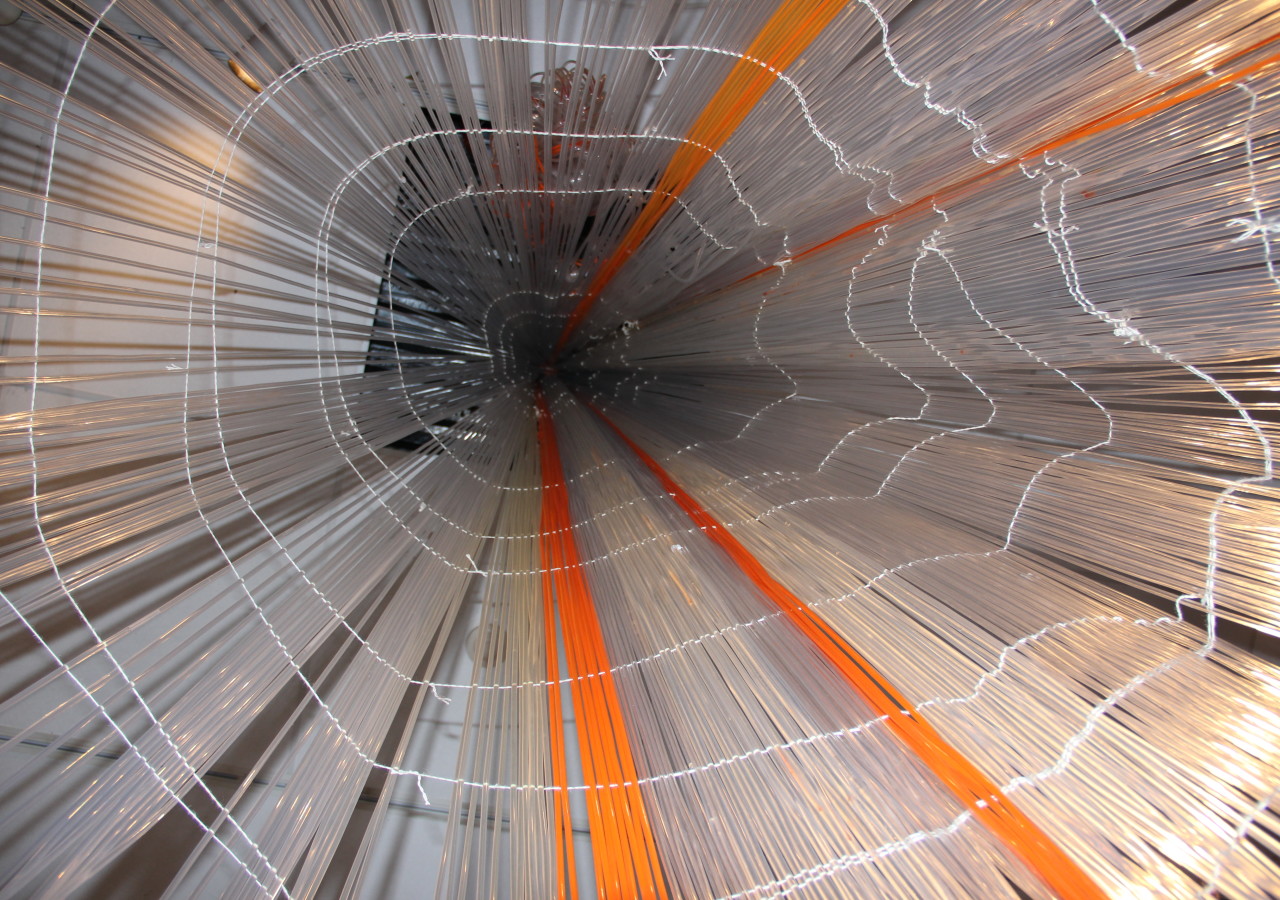
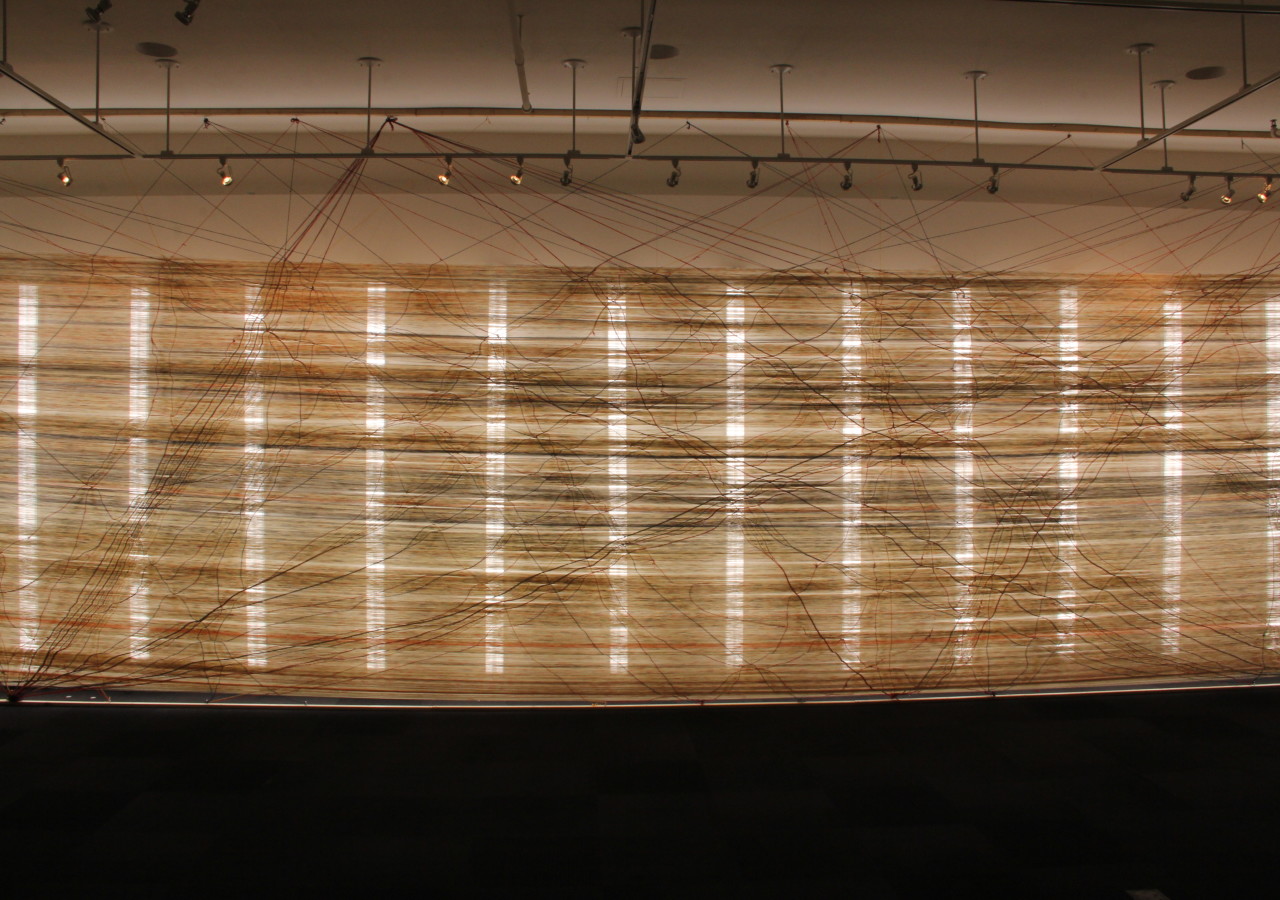
Born in Osaka, Japan but currently living and working in between Tijuana, Mexico and Dusseldorf, Germany, Shinpei Takeda is a visual artist exploring memories and traumatic histories. He is the co-founder of Aja Project – a nonprofit that teaches participatory photography to resettled refugee children, in San Diego, Colombia and Thailand, in order to “reclaim the[ir] world.’ His oeuvre is not limited to a specific medium; it includes multi-media installations, sound interventions, documentary films, large-scale photography installations, and collaborative community projects in various public contexts. Despite the variety of media and geographic locations that Takeda engages with, an impulse to use documentation and abstract representation to create sensory-immersive environments runs steadily throughout his work. For example in “Antimonument”, Takeda used oral stories he recorded from survivors of the atomic bomb who had moved to the Americas and “transcribed” them as voiceprints, using some of it to drape an entire room at the Nagasaki Prefectural Art Museum while the actual recordings were all playing at once in the background. In “Inscription: Beta Decay 7,” Takeda had an open call for poems about arrival. After receiving 113 poems, he devised a code to incorporate each poem as an individual string, ultimately putting all of them together using a traditional Oaxacan weaving technique. These are only two instances out of many more that show how Takeda relies on the act of documentation and then on the abstraction of the documentation to create alternative collective spaces that challenge the trauma of displacement that brought people to that particular space in the first place. His work uses abstraction to create sensorial experiences that attempt to negotiate trauma.
In telling a story about his career I was therefore interested in using a similar logic as his own to call attention to the “other” of his work, the condition of possibility that make his work possible: crises and the data that make them legible as such. This “other” is the second human geography that I’ve mapped through the multi-color lines, connecting the refugee population of five countries Takeda has worked with (Japan, Thailand, Germany, Colombia and Mexico) to the countries where they have been displaced to, according to U.N data from 2015. The color chosen is the dominant color as determined by an algorithm that analyzed different images from a Google search of “refugees/refugee camps” for each particular country. In doing so, I’m providing the viewer with clean data about refugee migrations, the aesthetics of photos about the refugee conditions in each country, and the patterns of migration between people who are differently constituted by legal migration discourse (the difference of mobility between an “artist” and a “refugee”) . The act of working with the data and producing this visualization leads me to ask: What happens to those who cannot or do not want be indexed by the requirements of clean data? What are the limits of the visual when it determines reality only when the subjects signified by the data allow themselves to be recognized as such? What responsibility do we hold to the messy data, the sifted through, the “information” put to the side when we visualize data through maps?
Gallery of selected works: